On shared hostingShared hosting Hosting where your website shares one server with many others. Cheap and simple; the host looks after the server. More about Shared hosting →, every account has limits on CPU, memory, processes and connections. When a site hits them, it slows down or shows 503 or 508 errors, even though nothing is “broken”. cPanelcPanel The most popular hosting control panel: a website where you manage your email, files, databases and domains with point-and-click tools instead of commands. More about cPanel →’s Resource Usage and Errors tools show what happened.
Open Metrics » Resource Usage. “Your site had no issues” means limits were not hit. Otherwise, Details and Current usage show which limit (CPU, memory, entry processes or I/O) and when. Then check Metrics » Errors for the error log, and fix the cause, usually cachingCache A saved copy of something, kept so it does not have to be made or fetched again. Like keeping a printed copy instead of reprinting it for every person who asks. More about Cache →, a heavy plugin or bots.
Resource Usage
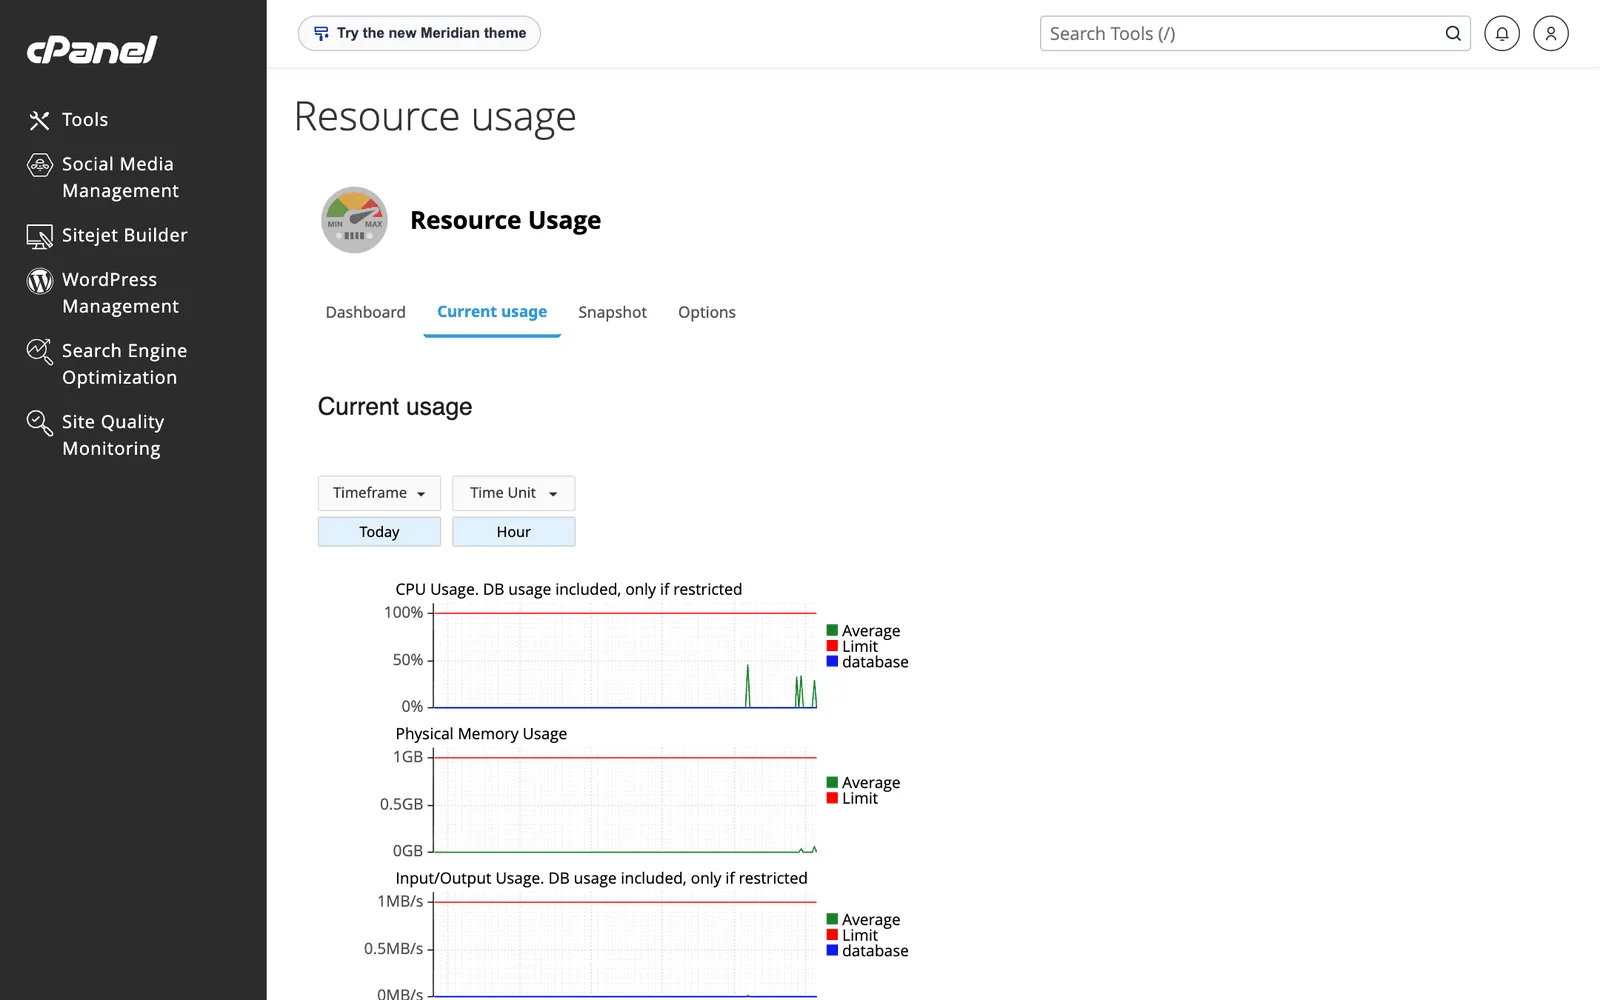
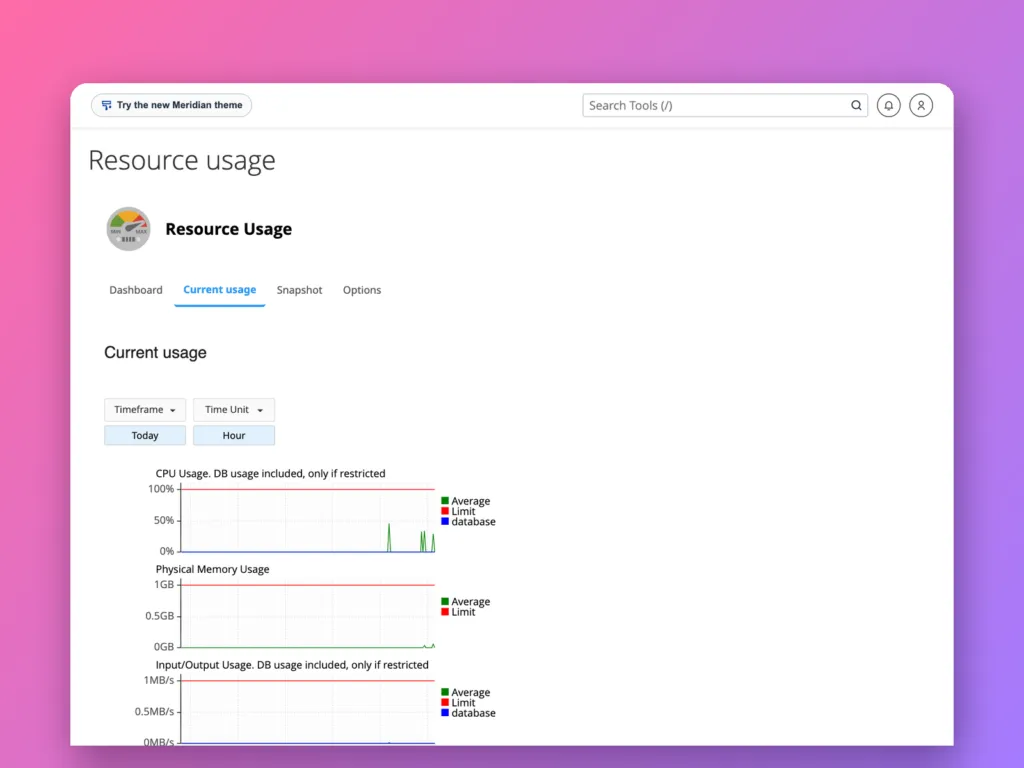
This tool comes from CloudLinux, which most shared hosts use to keep accounts from affecting each other. The Dashboard tab says whether your site hit a limit in the last 24 hours. Current usage shows graphs over the period you choose. Each graph has your usage and the limit line; usage touching the limit is the problem.
| Limit | What it measures | When it is hit, visitors see |
|---|---|---|
| CPU (SPEED) | Processor time | Slow pages |
| Physical memory (PMEM) | Memory used by your processes | 500 or 503 errors, failed requests |
| Entry processes (EP) | Requests being handled at the same moment | 508 Resource Limit Reached, or 503 |
| Number of processes (NPROC) | All running processes | Failures, including in cron jobs and email |
| I/O and IOPS | Disk reads and writes | Slow pages, slow backups |
Snapshot shows the processes and database queries running at a moment when a limit was hit, which often names the guilty script directly.
Common causes and fixes
| Pattern | Likely cause | Fix |
|---|---|---|
| Entry processes at the limit during traffic | Every visit runs PHP | Turn on page caching. See what caching is |
| CPU high at the same time each day | A cron job or backup plugin | Reschedule it, or run it less often |
| Steady high usage at quiet times | Bots crawling search, filters or login pages | Block abusive bots; limit wp-login.php access |
| Memory spikes on certain pages | A heavy plugin or large import | Find it in Snapshot; replace or optimise it |
| I/O high | Large backups or log files | Exclude caches from backups; clear old logs |
If real visitor traffic has outgrown your plan, an upgrade is the honest fix. See shared, VPS, dedicated or cloud hosting.
The error log
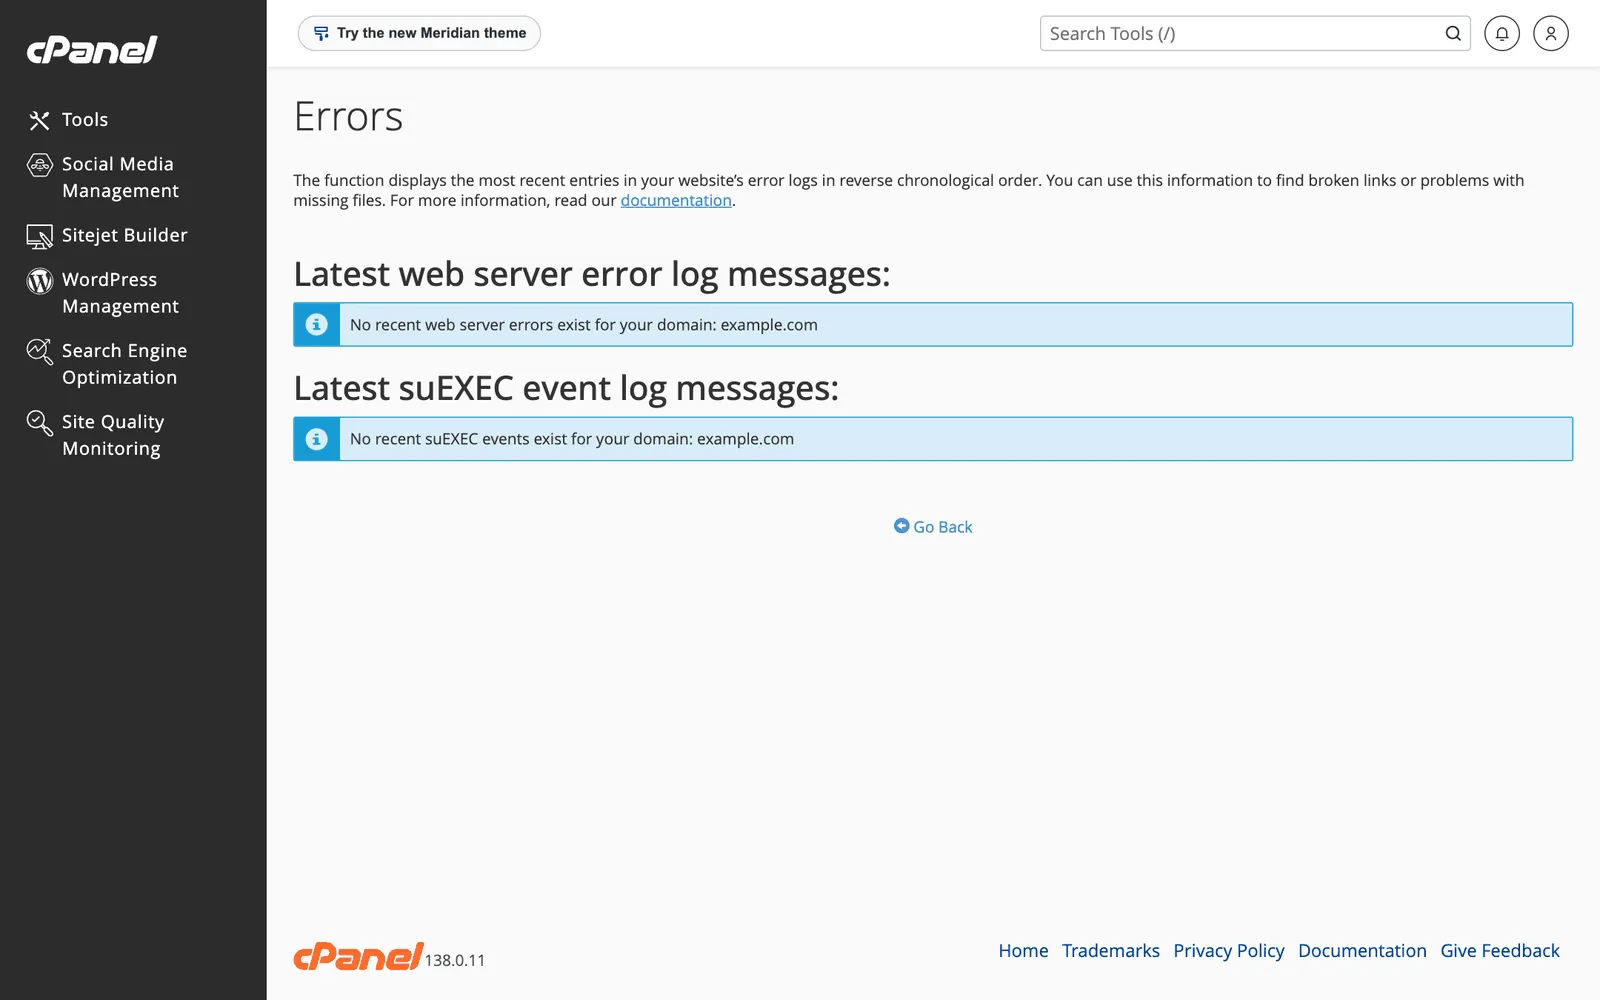
Metrics » Errors shows the newest web serverWeb server The program that answers visitors’ browsers and sends them your website. Also used for the computer it runs on. More about Web server → errors for your account: missing files, permission problems and PHP fatal errors. “No recent errors” is a good sign. When there are entries, the message usually names the file at fault.
PHP also writes errors to a file named error_log in the folder of the script that failed, such as public_html/error_log. Open it in File Manager, read the newest lines at the bottom, and delete it when done, since it can grow large.
Which error means what
| Visitors see | Read |
|---|---|
| 500 Internal Server Error | 500 fix: a code or .htaccess error, in the error log |
| 503 Service Unavailable | 503 fix: limits hit, or maintenance mode |
| 508 Resource Limit Reached | Entry process limit; see the table above |
| Critical error or blank page | White screen fix |
| Slow pages, no errors | CPU or I/O limits, or no caching |
Official documentation
- Errors, cPanel documentation.
Related
Something out of date? Software changes. If a step no longer works, tell us and we will check it and update the page.